What is an IQ score, really?
Most people know their IQ score is supposed to mean something. Fewer people know what it actually measures, how the number is calculated, or why a score of 100 is considered “average” by definition rather than by luck. If you have ever taken an IQ test and stared at your result wondering what to do with it, this article is for you.
Let’s start at the beginning.
An IQ score is not a raw count of questions answered correctly. It is a relative score. Your performance on a battery of cognitive tasks is compared to the performance of a large, representative sample of people your age. That comparison produces a number that tells you where you sit in the distribution, not how many questions you got right.
This matters more than it sounds. Two people can answer the same number of questions correctly and end up with different IQ scores if they are from different age groups. A 10-year-old who answers as many questions correctly as the average 12-year-old is considered above average for their age. The score captures relative standing, not absolute knowledge.
How the scale is built
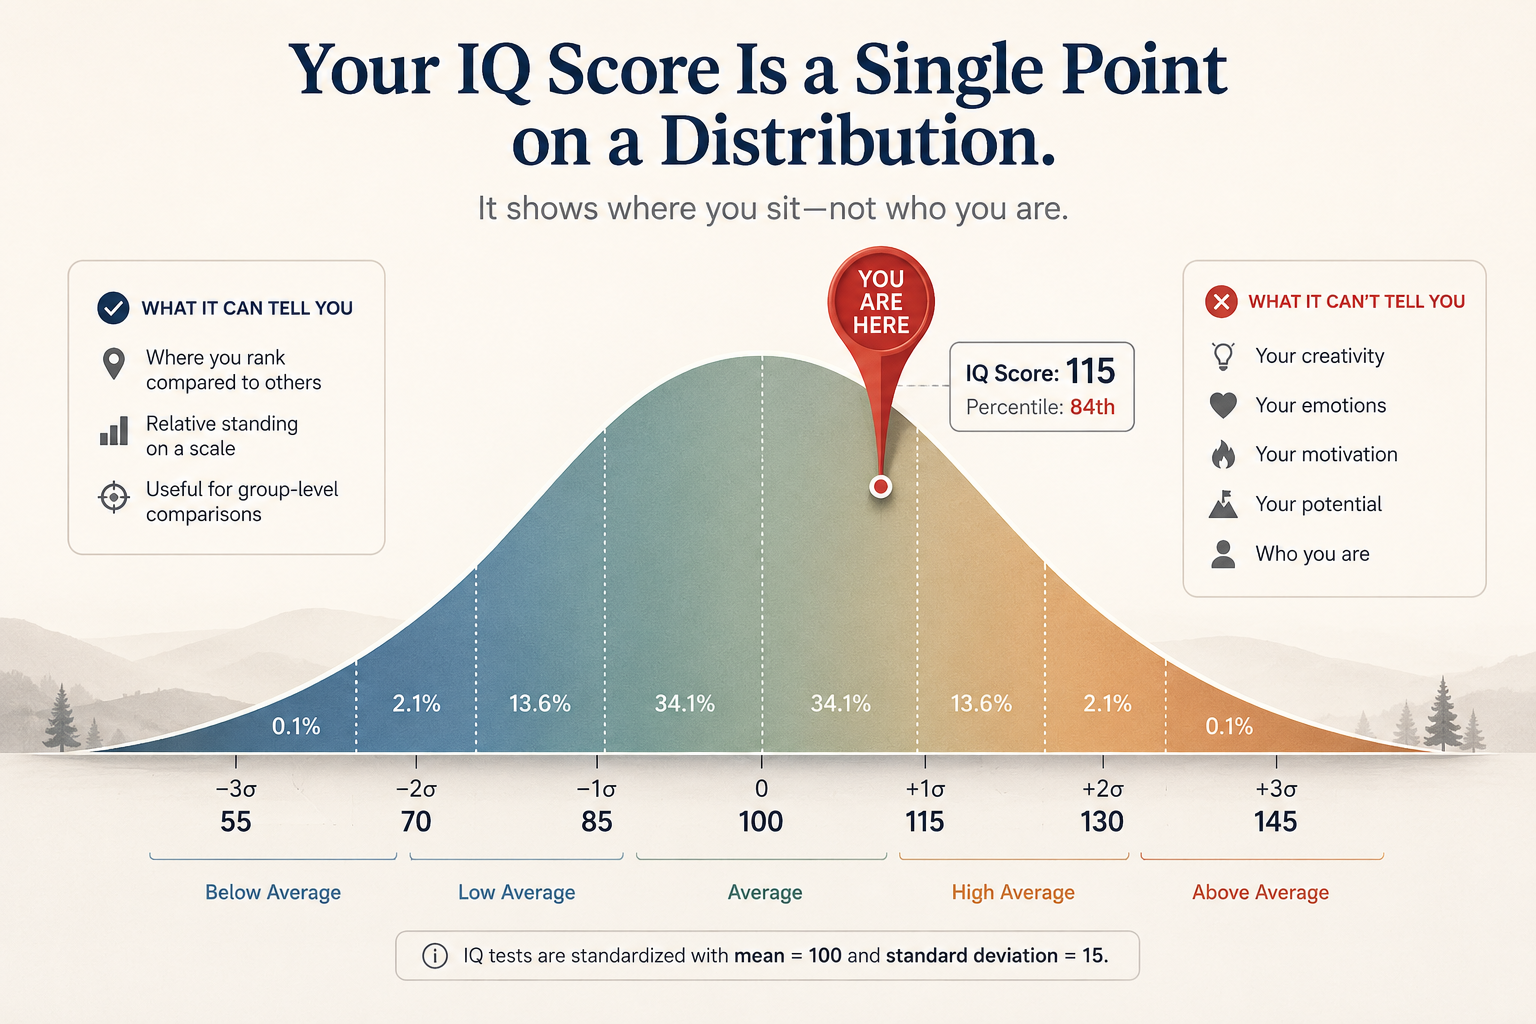
The IQ scale is designed as a bell curve, formally called a normal distribution. The average is set at 100, and the spread of scores is calibrated so that roughly 68 percent of people score between 85 and 115. That middle band, one standard deviation on either side of the mean, is what psychologists mean when they say “average range.”
The standard deviation in most modern IQ tests is 15 points. That single fact unlocks the whole scale:
- 130 and above: Two standard deviations above the mean. Roughly 2.3 percent of the population.
- 115 to 129: One to two standard deviations above average. About 14 percent of people.
- 85 to 115: The average range. Covers approximately 68 percent of the population.
- 70 to 84: One to two standard deviations below average. About 14 percent of people.
- Below 70: Two or more standard deviations below the mean. Roughly 2.3 percent of the population.
Those percentages are not arbitrary. They fall out of the mathematics of a normal distribution. The bell curve is symmetric, so the same percentage of people score above 130 as score below 70.
One thing worth knowing: different tests use slightly different standard deviations. The Wechsler scales (WAIS, WISC) use a standard deviation of 15. Some older tests used 16. If you compare scores across different instruments without checking which standard deviation each uses, the numbers will not line up the way you expect.
What the score is actually measuring
IQ tests do not measure a single thing called “intelligence.” They measure performance across a range of cognitive tasks, typically including verbal reasoning, working memory, processing speed, and spatial or visual reasoning. The composite score you receive reflects how your performance across all of those tasks compares to the norming sample.
Psychologists call the shared variance across these tasks the g factor, or general intelligence. The finding that people who do well on one type of cognitive task tend to do well on others is one of the most replicated results in all of psychology. But g is not the whole story. Most modern tests also report subscores that reveal a more detailed profile. Someone might score in the average range overall but show a significant gap between their verbal and spatial abilities. The composite number flattens that nuance.
For a deeper look at what these tests are actually designed to capture, our breakdown of what intelligence tests measure walks through the five cognitive factors the Stanford-Binet 5 assesses and where the concept of g fits in.
What the numbers predict (and what they don’t)
IQ scores are among the most studied predictors in all of social science. The research consistently links higher IQ scores to better educational outcomes, higher earnings, and even longer life expectancy. These correlations are real and they are not trivial.
But a correlation is not a guarantee. An IQ score is a probabilistic statement about a group, not a sentence for an individual. A person with an IQ of 95 can outperform a person with an IQ of 125 in almost any real-world domain, given enough motivation, opportunity, and deliberate practice. The score describes a starting distribution of likely outcomes, not a ceiling.
There is also the question of what IQ scores do not capture. Creativity, emotional intelligence, practical judgment, persistence, and social skill are all relevant to how well someone navigates life. None of them are reliably measured by a standard IQ test. A score tells you something real and useful about certain cognitive capacities. It does not tell you everything worth knowing about a person’s mind.
The Flynn Effect: why “average” keeps moving
Here is a fact that surprises most people: average IQ scores have been rising steadily across the 20th century, at a rate of roughly three points per decade in many countries. This trend, named after researcher James Flynn who documented it extensively, means that a test normed in 1980 would show today’s population scoring several points higher on average than the 1980 population did.
This is why IQ tests have to be periodically renormed. If the norming sample is too old, the test will systematically overestimate scores because it is comparing today’s test-takers to a less cognitively practiced historical population. The 100-point average is not a fixed point in space. It is always defined relative to the current population.
The Flynn Effect also raises a genuinely interesting question: if scores have risen so dramatically, are people actually smarter? Most researchers think the gains reflect improvements in abstract thinking, familiarity with test-taking, better nutrition, and more years of formal education rather than a fundamental change in raw cognitive capacity. The debate is ongoing and worth following.
Clinical tests versus online tests: a critical distinction
This is where honesty matters most.
A clinical IQ test, such as the Stanford-Binet 5 or the Wechsler Adult Intelligence Scale, is administered one-on-one by a trained psychologist. It takes two to four hours. The examiner observes not just your answers but how you approach problems, how you handle frustration, and whether your performance is consistent across subtests. The norming sample runs into the thousands of carefully selected participants. The result carries genuine diagnostic weight.
An online IQ test, including the one available on this site, is a self-administered cognitive assessment. It can give you a reasonable estimate of where your abilities sit relative to other people who take the same test. It is useful for self-knowledge and for getting a sense of your cognitive profile. It is not a clinical evaluation, and the score it produces should not be used for diagnostic, educational placement, or employment decisions.
The difference is not just a legal disclaimer. It reflects real differences in standardization, administration conditions, and the depth of the norming process. Understanding what makes a test official is worth reading before you place too much weight on any single result, online or otherwise.
If you need a score for clinical, legal, or educational purposes, you need an in-person evaluation with a licensed psychologist. Full stop.
How to read your own score
If you have a score in front of you, here is a practical framework for interpreting it.
First, locate it on the distribution. Is it within one standard deviation of 100 (that is, between 85 and 115)? If so, you are in the range that covers about two-thirds of the population. Scores in this range are genuinely average, not a euphemism for below average.
Second, look at the subscores if your test provides them. A composite score of 105 could reflect a flat, consistent profile across all subtests, or it could reflect a 120 in verbal reasoning and an 88 in processing speed. Those two profiles have very different practical implications.
Third, hold the number loosely. A single test, on a single day, under whatever conditions you happened to be in, is a snapshot. Cognitive performance fluctuates with sleep, stress, health, and familiarity with the test format. Researchers typically recommend averaging across multiple administrations before drawing strong conclusions.
Fourth, remember what the score does not tell you. It does not measure your curiosity, your work ethic, your creativity, or your capacity to grow. Those things matter enormously in life, and none of them appear on the scale.
The origin of the scale
The IQ scale as we know it was not Alfred Binet’s invention. Binet, working in Paris in the early 1900s, developed a test of mental age: a child who could answer questions typical of a 10-year-old was said to have a mental age of 10, regardless of their chronological age. The concept of dividing mental age by chronological age to produce a quotient came later, from German psychologist William Stern. The abbreviation “IQ” followed from there.
Binet himself was skeptical of reducing a child’s cognitive profile to a single number. He designed the test as a practical tool for identifying children who needed extra educational support, not as a fixed measure of innate capacity. The history of how his practical instrument became the global standard for measuring human intelligence is a fascinating and sometimes troubling story. The origin story of the Stanford-Binet test covers that arc in detail.
A number worth understanding
An IQ score is a useful piece of information. It is not a verdict. It is not a ceiling. And it is certainly not the full measure of a person.
What it is: a well-validated, carefully normed estimate of how your performance on certain cognitive tasks compares to others your age. That is genuinely useful to know, as long as you hold it alongside everything the number does not capture.
If you want to see where you sit on the scale, you can take the free cognitive assessment on this site. The result will give you a score and a breakdown of your performance across different cognitive dimensions. Treat it as a starting point for self-understanding, not a final answer about your mind.
FAQFrequently asked questions
What does an IQ score of 100 mean?
A score of 100 means you performed at exactly the average level for your age group on the test. It is defined as the midpoint of the distribution, not derived from any fixed number of correct answers.
Is a score above 130 considered genius?
A score above 130 places you in the top 2.3 percent of the population, which many tests label 'very superior' or 'gifted.' The word 'genius' is not a formal psychometric category and is used inconsistently in popular culture.
Can your IQ score change over time?
Your score can fluctuate from test to test due to factors like sleep, stress, and practice effects. Over a lifetime, IQ tends to be relatively stable in adulthood, though early childhood interventions and education can influence scores meaningfully.
Why do different IQ tests give different scores?
Different tests use different norming samples, different subtests, and sometimes different standard deviations. A score of 120 on one test is not necessarily equivalent to a 120 on another, which is why clinical evaluations specify which instrument was used.
What is the Flynn Effect?
The Flynn Effect is the observed rise in average IQ scores across the 20th century, roughly three points per decade in many countries. Researchers attribute it to better nutrition, more years of schooling, and greater familiarity with abstract thinking rather than a change in raw cognitive capacity.